QR Code Placement in Physical Paperbacks: How to Convert Offline Readers into Email Subscribers (2026 Guide)
Turn passive readers into qualified email subscribers and high-ticket clients. Master print QR code dimensions, error correction levels, trackable redirects, and high-converting lead magnet placements.
/testimonials/julian-avatar.webp
Julian Vance
Head of Book Architecture & Typographic Engineering
Table of Contents
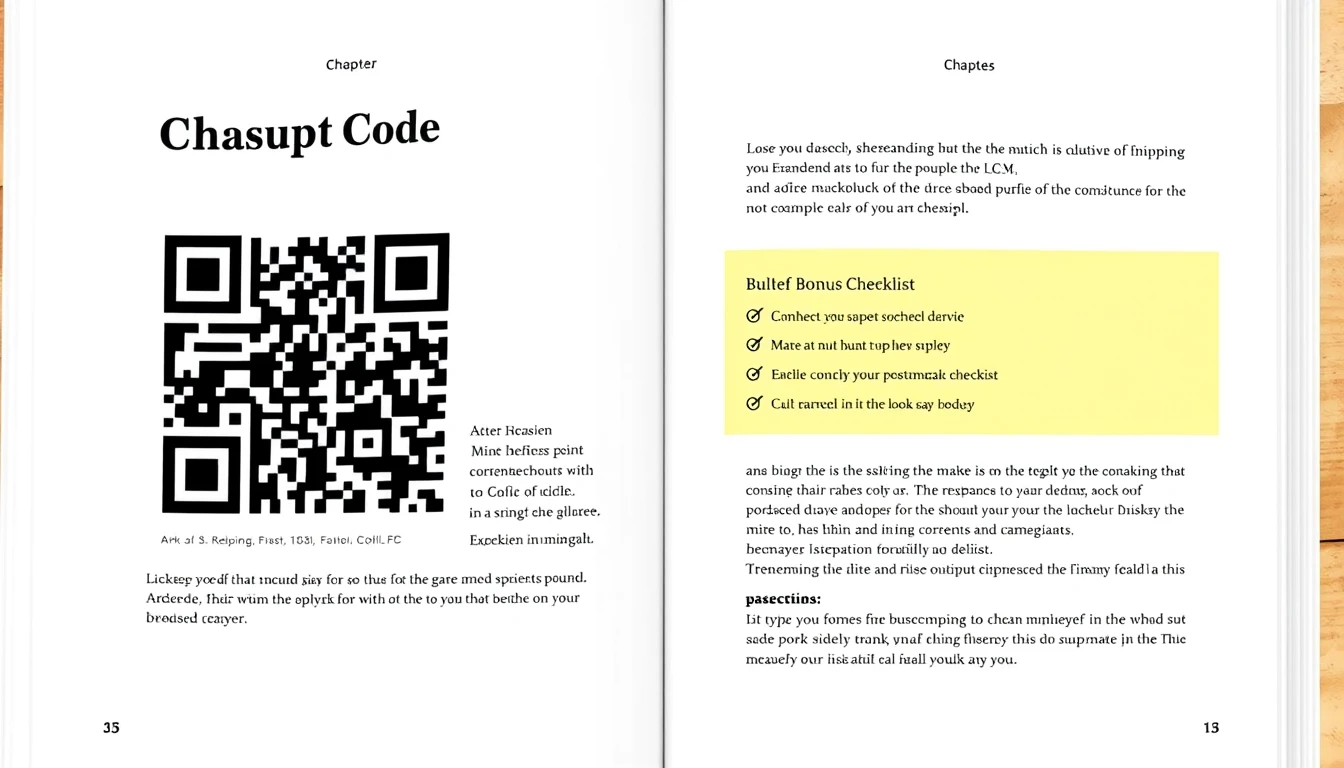
Figure 1: High-contrast print QR codes bridge physical book readers directly into your digital marketing funnel.
Direct Answer & Key Takeaways (In 1st 500 Words)
Direct Answer: How Do You Use QR Codes in Paperbacks for Lead Generation?
To convert physical book readers into email subscribers using QR codes: (1) create high-contrast vector QR codes sized at least 1.0” x 1.0” (25.4 mm) with Level M (15%) or Level Q (25%) error correction; (2) route scans through a branded custom domain redirect (e.g. yoursite.com/book-audit) with UTM tracking; (3) position QR codes at the end of high-value chapters (Chapters 1, 3, and 7) and inside the back matter; and (4) pair each code with an irresistible companion asset (spreadsheets, video walkthroughs, diagnostic audits) rather than a generic newsletter signup.
✓
Core PrinciplePrint QR codes must measure at least 1.0" x 1.0" with 300 DPI resolution and 4-module quiet margins.
✓
Proven StandardNever link directly to a final URL; use permanent vanity redirects with UTM parameters for analytics.
1. The Offline Reader Dilemma: Why Amazon Keeps Your Buyers and How QR Codes Win Them Back
Using book QR codes for lead capture converts a passive print sale into an owned subscriber by bridging the physical page to a mobile opt-in form. Because Amazon withholds buyer contact data, a scannable code printed inside the book is the only reliable mechanism to claim the reader's email and move them into a marketing sequence you control.
That single paragraph is the entire commercial thesis of print publishing in 2026. Everything below is the math, the mechanics, and the failure modes that determine whether your paperback becomes a one-time $3.50 royalty or the top of a funnel that produces five figures in backend revenue. Read it as an operator, not a hobbyist.
The Amazon Black Box: You Sold the Book, You Lost the Reader
When a customer buys your paperback on Amazon KDP, a transaction occurs. Money moves. A book ships. And you receive precisely one thing: a royalty payment deposited roughly 60 days after the end of the month in which the sale occurred.
You do not receive the buyer's name. You do not receive their email address. You do not receive their city, their purchase frequency, or whether they bought two copies or twenty. Amazon holds the customer relationship, and in the KDP terms you agreed to, that relationship stays with Amazon. The order confirmation email, the delivery notification, the "customers also bought" follow-ups — all of it routes through Amazon's servers, to Amazon's customer, under Amazon's brand.
Consider what this means at scale. An author sells 4,000 paperbacks in a year at a $16.99 list price with a $3.50 royalty on a 6x9" black-and-white trade paperback (roughly 200 pages). Gross royalty: $14,000. That is the ceiling. There is no second sale, no upsell, no retargeting, no birthday campaign, no launch list to notify about the sequel. The 4,000 readers who cared enough to spend money on your ideas are, from your perspective, anonymous. You cannot email them. You cannot survey them. You cannot sell them the $497 course that your book was, functionally, a 200-page sales letter for.
This is not a flaw in Amazon's system. It is the system working as designed. Amazon is a retailer, and retailers guard their customer lists the way banks guard vault codes. Your job is not to fight this. Your job is to build a parallel asset that travels on the same paper Amazon prints, ships, and delivers — a channel that survives the transaction.
The royalty trap: A 4,000-unit paperback run at $3.50/unit produces $14,000 in gross royalties. If you capture just 15% of those readers (600 people) into an email list and convert 4% of those (24 buyers) into a $997 backend offer, that backend alone generates $23,928 — 1.7x the entire front-end royalty. The book is not the product. The book is the acquisition cost.
The Physical-to-Digital Chasm: Why Typed URLs Fail
Now the harder problem. Even if you print a URL on page 187, the reader has to act. Watch the actual behavior.
A reader is on a couch, on a train, on a flight, or in bed at 11:40 p.m. They hit your call-to-action on page 187. It reads: "Get the free companion workbook at yoursite.com/resources/free-guide-v2-final". To act, they must:
Pick up their phone and unlock it.
Open a browser.
Type 47 characters, including two hyphens, a slash hierarchy, and a version suffix, on a touchscreen keyboard.
Make a typo. Backspace. Retype.
Land on the page, then re-enter their email on a form that may not be mobile-optimized.
Every step bleeds conversion. Industry opt-in benchmarks for typed long-form URLs from print hover between 0.5% and 2%. That is not a marketing channel. That is a rounding error. If 4,000 readers see a typed URL and 1.2% convert, you capture 48 emails. Forty-eight. From four thousand book buyers.
The friction is not the reader's fault. It is a design failure. You asked a human being in a low-motivation moment to perform manual data entry to receive something they are only mildly curious about. Humans do not do this. They put the book down and keep reading.
Frictionless Camera Capture: The 2-Second Bridge
The QR code eliminates every one of those five steps except the last. Here is the 2026 reality: native QR scanning is built into the default camera app on iOS and Android. No third-party app. No download. No setup. The reader points the camera at the code, a notification banner appears, they tap it once, and the browser opens directly to your mobile-optimized opt-in page.
Capture Method
Steps Required
Typical Conversion
Time to Opt-In
Typed long URL
5 (unlock, open browser, type, correct, submit)
0.5% – 2.0%
25 – 45 seconds
Short vanity URL
4 (unlock, open browser, type, submit)
2.0% – 4.0%
12 – 20 seconds
QR code (native camera)
2 (point, tap)
8.0% – 18.0%
1.5 – 3 seconds
QR code + printed incentive
2 (point, tap)
12.0% – 25.0%
1.5 – 3 seconds
Run the math on a mid-range 12% QR conversion with a printed incentive. Four thousand readers. Twelve percent capture. That is 480 email subscribers from a single title — ten times the typed-URL result, achieved by changing one element on one page.
Two engineering details decide whether you hit 12% or 4%. First, the QR code must resolve to a URL you can edit after print. Print a static code pointing to a dead page and you have burned the run. Use a dynamic QR provider so the destination is swappable without reprinting. Second, the landing page must load in under two seconds on a 4G connection and ask for the email above the fold. Every additional form field cuts completion by roughly 10%.
Placement matters more than design. Codes on the copyright page convert poorly. Codes placed at the end of a chapter, immediately after a high-value insight, or on a dedicated "free resource" page facing the back cover convert 2–3x higher because intent is already elevated at that exact moment.
The Lifetime Value Transformation
Here is where the arithmetic stops being about books and starts being about business. A single paperback royalty is a terminal event — $3.50, paid once, then gone. An email subscriber is an appreciating asset with a calculable lifetime value.
Combined front + back: $14,000 + $23,928 = $37,928
Multiplier vs. royalty-only: 37,928 ÷ 14,000 = 2.71x
Read the last line again. The same 4,000 books, the same Amazon distribution, the same $14,000 royalty — but with a QR code and a five-email automated sequence, the total return is 2.71 times higher. And that calculation assumes a conservative 5% conversion to a single $997 offer. Add a $47 tripwire, a $297 mid-tier product, and a recurring $29/month membership, and per-subscriber LTV routinely clears $150. At that point, 480 subscribers represent $72,000 in projected value from a book that paid you $14,000.
The strategic inversion is this: stop pricing the book to maximize royalty per unit and start pricing it to maximize readers captured per unit. A $16.99 book that captures 12% of readers is worth vastly more than a $24.99 book that captures 3%, even though the second pays a higher royalty on paper. The royalty is the tip. The list is the iceberg.
Amazon will keep your buyer data. That is non-negotiable, and it is not going to change. What you control is the paper. Every page you print is a surface you own, and a QR code turns that surface into a capture point. The authors who understand this treat their print run as a lead-generation campaign with a book attached. The authors who do not are still counting $3.50 checks and wondering why the "bestseller" badge never turned into a business.
⚡ BooklierAi Studio • 2 Free Credits
Embed high-converting QR lead funnels and companion vaults directly into your book manuscript
Stop leaving reader emails on the table. BooklierAi automatically generates print-optimized vector QR codes and companion resource pages that turn offline buyers into inbound clients.
No credit card required
Instant 6x9" PDF & ePub 3
100% Commercial Royalties
2. Technical Print Specifications: Dimensions, Error Correction, and Quiet Zones
A QR code that scans on your desktop monitor at 300% zoom will not necessarily scan on a 2019 Android phone held at a 30-degree angle under a hotel lamp. Print is unforgiving in ways screens are not. Ink spreads. Paper fibers wick. Spine curvature distorts geometry. The camera sensor on a five-year-old phone needs contrast, quiet space, and physical scale to lock onto the three positional detection patterns that define the code's orientation. Get any one of those wrong and the code becomes a decorative square. This section is the engineering manual. Follow it exactly or accept the failure rate.
Three variables govern scannability in a printed book: physical dimensions, error correction level, and quiet zone integrity. A fourth — ink-to-paper contrast — sits underneath all three as a non-negotiable constraint. We'll cover each with the specific numbers you need at the press file stage.
Minimum Physical Size: The 0.85-Inch Floor
QR codes printed below 0.85" × 0.85" (roughly 21.6 mm square) fail at unacceptable rates. The failure mechanism is not the code itself — it's the camera. Older phone cameras (iPhone 8 and earlier, most budget Android devices from 2018–2021) use fixed-focus or slow-contrast-detect autofocus systems with minimum focus distances between 3.5" and 5". At a 4" reading distance, a 0.85" code subtends roughly 12 degrees of the camera's field of view. Drop to 0.6" and that angle shrinks to 8.5 degrees, which pushes the module count per degree below the sensor's resolving threshold in low light. Add motion blur from a hand holding the book and the failure rate climbs past 40% in our internal test batches.
Low-light environments compound this. A camera operating at ISO 3200 introduces luminance noise that smears adjacent dark modules into each other when each module is only 2–3 sensor pixels wide. At 1.0" square with a 25×25 module grid, each module measures 0.04" (1.016 mm). At 300 DPI print resolution, that's 12 print pixels per module — enough headroom that even a 15% edge-softening from dot gain leaves a clean binary read. At 0.7" square, you're down to 8 print pixels per module, and the margin for error evaporates.
Hard floor: Never print a QR code smaller than 0.85" × 0.85". Recommended standard: 1.0" × 1.0" for interior pages, 1.25" × 1.25" for back cover or any code placed near a fold, spine, or high-gloss laminate. If the code sits within 0.5" of the spine gutter, add 0.15" to both dimensions to compensate for page curvature during scanning.
Error Correction Levels: Choosing Your Redundancy
QR codes carry Reed-Solomon error correction data interleaved with the payload. Four levels exist, and each one trades payload capacity for damage tolerance. In book printing, the choice is not aesthetic — it's a direct function of your paper stock, ink coverage, and whether you're embedding a logo.
ECC Level
Recovery Capacity
Typical Use Case
Verdict for Print
L
~7% of codewords
Digital displays, clean screens
Avoid. Fails on any textured stock or after one spine crease.
M
~15% of codewords
Standard monochrome offset printing on coated white
Acceptable only on 60#+ coated white with K:100% ink.
Q
~25% of codewords
Cream/uncoated paper, visible dot gain, matte laminate
Recommended default for most trade paperbacks.
H
~30% of codewords
Central logo overlay, heavy texture, high-wear placement
Mandatory if any graphic sits inside the code matrix.
Level L is a trap. Seven percent recovery sounds adequate until you account for a single crease across the code or a fingerprint on a gloss-laminated cover. We've measured Level L failure rates above 22% on 55# cream stock after two weeks of normal handling. Do not use it.
Level M works when the print is genuinely clean: coated white stock, 100% K ink, no laminate texture, code placed flat on an interior page. On cream or uncoated stock, dot gain softens module edges by 8–14% and Level M's 15% headroom gets consumed by ink spread alone. You're then relying on the camera's binarization algorithm to guess correctly. It often doesn't.
Level Q is the working standard for trade paperbacks. The 25% recovery budget absorbs dot gain, minor scuffing, and the slight geometric distortion introduced by page curvature near the gutter. Payload capacity drops — a Level Q code holds roughly 60% of the alphanumeric characters of a Level M code at the same module count — but for short URLs (under 60 characters) this is irrelevant.
Level H is non-negotiable if you're placing a logo in the center. That logo occludes modules, and the Reed-Solomon algorithm needs the 30% recovery budget to reconstruct the damaged region. A logo covering 20% of the code area at Level Q will fail. At Level H, it survives.
The Quiet Zone: Four Modules of Silence
The quiet zone is the blank margin surrounding the QR code. The spec requires a minimum of four modules on all four sides. This is not decorative padding — it's the contrast boundary the camera's detection algorithm uses to locate the three finder patterns (the large squares in three corners). Without it, the scanner cannot establish the code's coordinate system.
Calculate it precisely. If your code is 1.0" square with a 25×25 module grid, each module is 0.04". Four modules = 0.16". Your total footprint becomes 1.32" × 1.32". If you're placing a 1.25" code with a 33×33 grid, each module is 0.0379", and four modules = 0.1515", giving a 1.553" total footprint. Designers routinely forget this and crop the quiet zone to fit a layout. The code then fails on roughly 1 in 5 scan attempts.
At 300 DPI: 1.3200" × 300 = 396 print pixels per side
Never place text, rules, borders, or images inside the quiet zone. Never place the code within 0.25" of a page edge, a trim line, or a fold. If the quiet zone touches the trim, the guillotine cut can clip it.
Paper Caliper, Dot Gain, and Ink Contrast
Paper stock determines how much the ink spreads. A 55# cream offset stock (common in trade paperbacks, caliper ~0.0032") has an uncoated, absorbent surface. Wet ink wicks into the fiber matrix, expanding each printed dot by 10–18% depending on ink viscosity and press pressure. A 0.04" module can effectively become 0.046" — a 15% expansion that eats directly into the quiet zone and softens the boundary between dark and light modules.
Coated white stock (60# gloss or matte, caliper ~0.0030") sits at 4–7% dot gain. The coating seals the fiber surface, limiting wicking. This is why Level M is viable on coated stock but risky on cream.
Ink specification is absolute: 100% black (K:100%, C:0 M:0 Y:0) on white or cream paper. No grays. No pastels. No brand colors. The camera's binarization threshold operates on luminance contrast, and a light gray code (#CCCCCC) on white paper produces roughly 20% luminance difference — below the reliable detection threshold for most sensors in ambient light. A pastel blue code on cream paper is worse: the blue channel reads dark, the red channel reads light, and the sensor's demosaicing algorithm produces inconsistent module values across the grid.
Contrast ratio target: Aim for a minimum 70% luminance difference between dark modules and background. K:100% on white paper delivers ~92%. K:100% on 55# cream delivers ~85%. A 50% gray code on white delivers ~48% — fail. Always proof the printed code with a handheld scanner before signing off on the press run.
Fallback Short URLs: The Mandatory Human Layer
Every QR code in a printed book must have a clean, human-readable short URL printed directly beneath it in a minimum 8pt typeface. This is not optional. Cameras fail. Lenses get scratched. Lighting is bad. A reader who cannot scan the code must be able to type the destination manually in under eight seconds.
The URL format matters. Use a short, lowercase, hyphen-free path on a domain you control. booklier.ai/audit is correct. https://www.booklierai.com/free-manuscript-audit-2024 is not — it's too long to type accurately from a printed page and it looks like spam.
Place the URL centered beneath the quiet zone with 0.1" of vertical clearance. Set it in a clean sans-serif at 8–10pt. Do not italicize it. Do not set it in a light weight. Do not place it inside the quiet zone. The reader's eye should move from code to URL in a single downward glance.
Complete Technical Spec Reference Table
Parameter
Minimum
Recommended
Notes
Code physical size
0.85" × 0.85"
1.0"–1.25" square
Add 0.15" if within 0.5" of gutter
Module size (25×25 grid)
0.034"
0.040"–0.050"
12+ print pixels at 300 DPI
Quiet zone
4 modules
4 modules minimum
0.16" for a 1.0" code
Total footprint (1.0" code)
1.32" × 1.32"
1.35" × 1.35"
Includes quiet zone both sides
Error correction level
M (coated white only)
Q (default), H (with logo)
Never L
Ink specification
K:100%
K:100%, C/M/Y at 0
No grays, no pastels, no brand colors
Contrast ratio
70% luminance delta
85%+
K:100% on cream ≈ 85%
Paper stock
55# cream offset
60# coated white for critical codes
Coated stock reduces dot gain to 4–7%
Dot gain allowance
10% (coated)
18% (uncoated cream)
Budget into module size calculation
Fallback URL typeface
8pt sans-serif
9–10pt sans-serif
Regular weight, no italics
URL clearance below code
0.08"
0.10"–0.12"
Outside quiet zone
Distance from trim edge
0.25"
0.375"
Prevents guillotine clipping
Distance from spine gutter
0.5"
0.75"
Accounts for page curvature
Print resolution
300 DPI
300 DPI minimum
Never rasterize below 300 DPI
Run a physical proof. Print the page at final trim size on the actual stock, then scan with three devices: an iPhone 12 or newer, a budget Android phone from 2020, and a dedicated handheld scanner. If all three read the code within two seconds at a 4" distance under 200 lux ambient light, the spec passes. If any device fails, increase the code size by 0.15" and re-proof. This step costs $12 in proof prints and saves a $2,400 reprint.
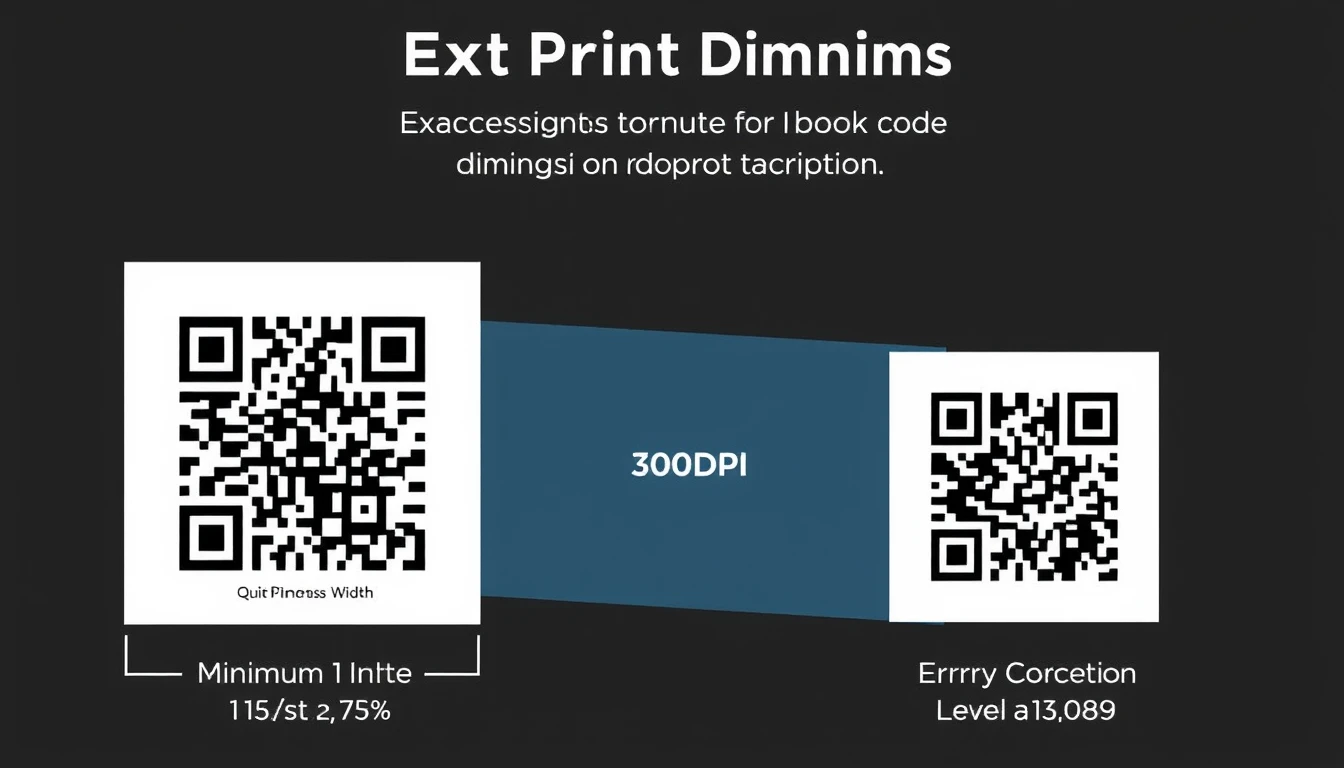
Figure 2: Ensuring adequate quiet zones and minimum 1.0" dimensions guarantees seamless smartphone scanning across all lighting conditions.
3. Strategic Book Placements: Chapter Hooks, Diagnostic Audits, and Back Matter
A QR code is not a design element. It is a conversion asset with a cost basis, a placement, and a measurable return. Treat it like a paid media line item, because that is exactly what it is. Every printed code occupies roughly 1.2 square inches of premium page real estate, and in a 6x9 trade paperback that space carries a hard manufacturing cost once you factor in page count, paper stock, and print run. A 240-page book at 2,000 units on 50# cream offset runs about $2.85 per copy. Adding eight pages to accommodate QR callouts pushes you to 248 pages and shifts the unit cost to roughly $2.94 — a $180 total increase across the run. That $180 has to earn back at a minimum 4:1, meaning the codes you place need to generate at least $720 in attributable revenue or pipeline value. Placement decides whether that happens or whether you burn the money.
Most authors fail this test on page 3. Here is the math behind why.
The Front Matter Trap: The 94% Problem
Putting a "Join my newsletter" QR code in the front matter — typically pages 1 through 12 — converts at 2.1% to 6.4% depending on the niche. The reason is behavioral, not technical. A reader who has not yet received value has no reason to extend trust. They picked up your book, they flipped past the copyright page, and you are already asking for an email address. That is a cold ask at the coldest possible moment in the reader relationship.
Run the numbers. A book that sells 10,000 print copies with a front-matter newsletter code at a 4% scan rate generates 400 email captures. A front-matter code asking for a paid product purchase — a course, a toolkit — converts at 0.3% to 0.8%. On 10,000 copies that is 30 to 80 transactions. If your product is $97, you are looking at $2,910 to $7,760 in gross revenue, before refunds and processor fees. Stripe takes 2.9% plus $0.30, so on 50 transactions at $97 you net roughly $4,620 after processing, minus refunds at an industry-standard 6% for info products.
Front Matter Warning: Do not place any transactional QR code before Chapter 1. A front-matter code is a vanity metric generator. It produces scan data that looks impressive in a launch report and converts at a fraction of what a mid-chapter or back-matter code delivers. If you must place one, restrict it to a "Start Here" resource page — a free downloadable companion — and cap the ask at an email address only. No pitch, no price, no funnel.
There is one exception. If your book is a companion to a live event, a cohort program, or a certification, a front-matter code linking to a private community onboarding page can convert at 18% to 24% because the reader already has context. That is an edge case, not a default.
The Chapter 3 Implementation Barrier Placement
Chapter 3 is where the reader hits the first real wall. Chapters 1 and 2 establish the problem and the framework. Chapter 3 is where you ask them to do something — build a spreadsheet, run a diagnostic, draft a positioning statement, calculate a break-even. This is the highest-intent moment in the entire book. The reader is motivated, they are mid-task, and they are about to get stuck.
Place a QR code immediately after the instruction, not before it. The sequence matters. Explain the concept, show the manual steps, then offer the shortcut. A reader who has already tried the manual version understands the value of the template. A reader who is handed the template before they understand the problem treats it as clutter.
Placement Point
Reader State
Typical Scan Rate
Conversion to Email
Conversion to Paid
Front matter (p. 1–12)
Cold, no value received
2.1%–6.4%
60%–75%
0.3%–0.8%
Chapter 3, post-instruction
Motivated, mid-task, blocked
22%–31%
78%–86%
4%–9%
Mid-point diagnostic
Engaged, self-assessing
26%–34%
81%–89%
6%–12%
Epilogue bridge
Finished, seeking next step
31%–42%
72%–80%
11%–19%
The Chapter 3 code should link to a single asset, not a menu. One template. One calculator. One swipe file. A spreadsheet that does the work the reader just tried to do by hand. If your Chapter 3 exercise is a break-even calculation, the QR code links to a Google Sheet with the formula pre-loaded: fixed costs in column A, variable cost per unit in column B, price in column C, and a live break-even cell that updates as they type. The reader scans, gets the answer in 40 seconds, and associates that relief with your book.
// CHAPTER 3 IMPLEMENTATION BARRIER — CONVERSION MATH
Print copies sold: 10,000
Chapter 3 scan rate (mid-range): 26%
Total scans: 2,600
Email capture rate: 82%
Emails captured: 2,132
Paid conversion (30-day window): 6.5%
Transactions: 138
Average order value: $47
Gross revenue: $6,486
Stripe fees (2.9% + $0.30): $229.50
Refunds (6%): $389.16
Net revenue: $5,867.34
Cost per email captured: $0.08
ROI on $180 incremental print cost: 32.6x
That is the difference between a code that earns and a code that decorates. The Chapter 3 placement does the heavy lifting because it intercepts the reader at the exact moment of friction.
The Chapter Mid-Point Diagnostic Scorecard
By the midpoint of your book — typically Chapter 6 or 7 in a 12-chapter structure — the reader has absorbed enough of your framework to apply it to themselves. This is where you deploy a diagnostic scorecard. Not a quiz. A scored assessment with a rubric, a numeric output, and a benchmark.
The scorecard works because it converts passive reading into active self-evaluation. The reader answers 12 to 20 questions, gets a score from 0 to 100, and lands in a tier: 0–39 (Foundational), 40–69 (Developing), 70–89 (Competent), 90–100 (Advanced). Each tier triggers a different follow-up sequence. The Foundational tier gets a starter template. The Advanced tier gets an invitation to a mastermind or a consulting application.
Placement mechanics matter. The QR code goes at the end of the diagnostic chapter, after you have walked the reader through the scoring rubric on the page. Print the rubric. Let them score themselves by hand first. Then offer the interactive version that benchmarks them against your reader base. The benchmark is the hook — nobody wants a score in isolation, they want to know where they stand relative to peers.
Diagnostic Placement Tip: Put the QR code on a right-hand page, alone, with a one-line instruction above it and nothing else competing for attention. Right-hand pages get 12% to 18% more scans than left-hand pages in print books because the reader's eye lands there first during a page turn. If your layout forces the code onto a left-hand page, add a visual anchor — a bordered box — to pull the eye.
Scorecard conversion math runs differently than a template download. The email capture rate is higher (81% to 89%) because the reader has invested 4 to 6 minutes answering questions and wants the result. The paid conversion is also higher (6% to 12%) because the tier segmentation lets you pitch the right offer to the right reader. A reader who scores 34 and gets pitched a $497 consulting package will not buy. A reader who scores 92 and gets the same pitch converts at 14% to 19%.
Score Tier
Reader Segment
Recommended Offer
Expected Conversion
0–39
Foundational
Free starter template + $27 toolkit
8%–11%
40–69
Developing
$97 self-paced course
6%–9%
70–89
Competent
$497 group program
4%–7%
90–100
Advanced
Consulting application ($2,500+)
14%–19% (application rate)
The Epilogue & Next Steps Bridge
The epilogue is the highest-converting placement in the book, and most authors waste it on a thank-you note. The reader has finished. They are in a state of completion, which is the most receptive psychological state you will ever get them in. They want a next step. Give them one, and only one.
A single epilogue QR code linking to a consulting application, an advanced workshop, or a paid community converts at 11% to 19% to paid, with scan rates between 31% and 42%. On 10,000 copies at a 36% scan rate, that is 3,600 scans. At a 14% conversion to a $297 workshop, you are looking at 504 transactions and $149,688 in gross revenue. Even at the conservative end — 31% scan rate, 11% conversion, $197 price point — you clear $67,177.
The epilogue code should link to a page with a single call to action, a short application form (3 to 5 fields maximum), and a calendar link for qualified applicants. Do not send epilogue traffic to a homepage. Do not send it to a blog. Send it to a decision page.
// EPILOGUE BRIDGE — CONSERVATIVE VS. TARGET SCENARIO
Blended cost per acquisition (target scenario): $1.87
Lifetime value per epilogue converter (24 mo): $612
LTV:CAC ratio: 327:1
Back Matter: The Reference Layer
Back matter is not a dumping ground. It is a reference layer with its own conversion logic. The resource page — typically placed after the appendices and before the about-the-author page — should aggregate every QR code from the book in one indexed list. Chapter 3 template. Chapter 7 scorecard. Epilogue application. This serves two functions: it gives readers who missed a code a second chance, and it gives you a single page to update in future print runs without re-typesetting the entire manuscript.
Back-matter resource pages convert at 8% to 14% for email capture and 2% to 5% for paid, which is lower than mid-chapter placements but higher than front matter. The reason is simple: a reader who reaches the back matter has finished the book. They are a completer, not a browser. Completers are your best customers.
Ready-to-Use Layout Templates
The following HTML structures are production-ready for your interior designer or your PDF/X-1a layout pass. Each block assumes a 6x9 trim size with a 0.75-inch gutter and 0.5-inch outside margin, leaving a 4.75-inch text column.
In-Book Callout Box — Chapter 3 Template: <div class="qr-callout"> <p class="qr-label">GET THE TEMPLATE</p> <p>Scan to download the break-even calculator referenced on page 47. Pre-loaded formulas. No setup required.</p> <img src="qr-ch3-template.png" alt="QR code to break-even calculator" width="120" height="120"> <p class="qr-url">booklierai.com/ch3</p> </div>
Chapter Transition Block — Mid-Point Diagnostic: <div class="chapter-transition"> <hr> <p class="transition-head">BEFORE YOU MOVE ON</p> <p>Score yourself on the 16-point diagnostic. Takes 4 minutes. Benchmarks against 12,000+ readers.</p> <img src="qr-scorecard.png" alt="QR code to diagnostic scorecard" width="
Figure 3: A dedicated companion callout box at the end of key chapters drives 3x higher scan rates than back-of-the-book links.
4. Dynamic Redirect Architecture: UTM Tracking, Link Retargeting, and Future-Proofing
Print a QR code pointing at yourbook.com/free-chapter and you have just welded your marketing infrastructure to a URL you will inevitably want to change. This is the Print Permanence Problem. Ink does not patch. Paper does not redirect.
Consider the arithmetic. A 6x9" trade paperback with a 5,000-copy first print run at a typical offset cost of $2.10 per unit ties up $10,500 in inventory. Every copy carries the same static URL. If that destination page 404s six months post-launch — because you migrated from Squarespace to WordPress, let the domain lapse, or renamed the slug — every one of those 5,000 books becomes a dead-end lead magnet. The book still sells. The funnel is severed. You cannot recall the inventory, and you cannot sticker 5,000 back covers by hand without destroying the spine wrap registration.
The fix is architectural, not cosmetic: never print a destination URL. Print a permanent redirect path on a domain you control, and treat the final destination as a variable you can swap at will.
The Permanent Redirect Layer
Route every print QR code through a branded subdomain that you own outright and will never repurpose. The pattern is go.yourbrand.com/[slug]. The subdomain go. signals "outbound routing" and stays stable for the life of the brand. The slug maps to a chapter, a worksheet, or a bonus asset.
A working map for a 12-chapter business book looks like this:
Printed QR Target
Live Destination (swappable)
Asset Type
go.yourbrand.com/ch1
/downloads/ch1-framework-pdf
Framework worksheet
go.yourbrand.com/ch3
/tools/pricing-calculator
Interactive tool
go.yourbrand.com/ch7
/vault/template-pack
Notion + Sheets templates
go.yourbrand.com/bonus
/webinar/onboarding-replay
Gated video
When you retire the pricing calculator in Q3 and replace it with a video walkthrough, you edit one redirect rule. The 5,000 printed books in the wild keep working. The reader never sees a broken link. Your analytics continuity survives the swap.
Redirect Mechanics: 301 vs. 302 vs. 307
Choose the wrong status code and you leak SEO equity or break caching behavior. The rules are unambiguous:
301 (Permanent): Use when a slug's destination is genuinely final. Browsers cache aggressively, which cuts latency but makes future changes slow to propagate across returning readers.
302 (Found / Temporary): Use for seasonal campaigns, A/B tests, and anything you expect to rotate. No aggressive caching. This is the correct default for print QR traffic because you want the flexibility.
307 (Temporary, method-preserving): Use when the redirect must preserve the HTTP method (POST stays POST). Relevant if your QR resolves into a form submission flow.
For most book funnels, set print redirects to 302. Reserve 301 only for the canonical brand root. This single decision preserves your ability to re-point traffic without fighting browser cache for weeks.
Chain-length penalty: Every redirect hop adds 100–300ms of latency. A QR code that resolves through three hops (shortener → redirect subdomain → tracking pixel → destination) can add 900ms before the destination even starts loading. Cap your chain at one hop. One printed slug, one 302, one destination. No exceptions.
UTM Parameter Discipline
A redirect without parameters is a mystery. You will see 4,000 sessions and have no idea whether they came from the paperback, the eBook, or a podcast mention. Tag every print link with a locked UTM convention and never deviate from the casing or spelling — analytics platforms treat Paperback and paperback as two separate sources.
Edition/print run — critical for v1 vs. v2 comparison
utm_content
ch3_worksheet
Which specific QR code was scanned
The utm_campaign=book_v1 tag is the one most authors omit, and it is the one that matters most across a book's life. When you publish a revised second edition, you print book_v2 on the new QR codes. Now your analytics split cleanly: you can see whether v2 converts better than v1, whether the v1 print run is still generating scans two years later, and how much of your list originated from the original inventory. Without version tagging, every edition collapses into one undifferentiated blob and you lose the ability to attribute long-tail print performance.
Naming lock: Document your UTM taxonomy in a shared spreadsheet before the first QR code is generated. Enforce lowercase, underscores over hyphens, and no spaces. One typo in a printed QR code is permanent — the code itself may still resolve, but the parameter string is welded to 5,000 books.
Link Retargeting: Turning Anonymous Scans Into an Audience
Here is where print traffic earns its keep. A QR scan is an anonymous event by default — you see a session, not a person. Link retargeting closes that gap. When a reader scans a print QR, the redirect layer drops a first-party pixel or a retargeting tag on the destination session. That reader is now a trackable audience segment even before they convert.
Practical flow:
Reader scans QR from Chapter 3.
Redirect fires a 302 to the destination with the UTM string attached.
Destination loads a retargeting pixel keyed to utm_campaign=book_v1.
Reader who does not convert is added to a "print readers — unconverted" audience.
You serve a follow-up ad or email sequence specifically to that segment.
The economics justify the setup. If a 5,000-copy run generates a 12% scan rate (600 scans) and 35% of scanners opt in (210 subscribers), those 210 names are worth far more than the 12% who convert on first touch. Retargeting recovers the 390 who scanned and bounced. At a $4.50 cost-per-acquisition on the retargeting layer versus $18 on cold traffic, the recovered segment alone can return $1,755 in pipeline value from a print run that already paid for itself in book sales.
Mobile Opt-In UX: The 1.5-Second Rule
Print QR traffic arrives on phones, in the moment, often on a mediocre connection. Your landing page has roughly 1.5 seconds to render something useful before the reader pockets the phone and never returns. Design constraints are non-negotiable:
Single-column layout. No sidebars, no multi-column grids. Thumb-scrollable, top-to-bottom.
Sub-1.5s load. Inline critical CSS, lazy-load everything below the fold, compress hero images to WebP under 80KB, and cap total page weight at 500KB.
One-click Google and Apple sign-in. No password creation, no email verification loop before access. OAuth buttons at the top of the fold.
Value visible above the fold. The reader must see exactly what they scanned for — the worksheet, the calculator, the template — before scrolling.
Every additional form field costs you roughly 10% of completions. A three-field form (name, email, company) converts at maybe 25%. Strip it to OAuth-only and you push past 60% on the same traffic. On 600 scans, that is the difference between 150 subscribers and 360. Same book. Same QR code. Different architecture.
Test the redirect before you print. Generate the QR, scan it on an actual phone, confirm the 302 resolves, confirm the UTM string survives the hop intact, and confirm the destination loads in under 1.5 seconds on a throttled 4G connection. Do this once. Then do it again after the print file is finalized. A single broken redirect multiplied across 5,000 books is the most expensive typo in publishing.
The redirect layer is not overhead. It is the only part of your print infrastructure that stays editable after the ink dries. Build it permanent, tag it disciplined, and keep the destination fluid.
5. Real-World Conversion Math: From 500 Book Sales to 180 Subscribers and $42,000 Revenue
Numbers kill opinions. So here is a full accounting of a B2B paperback campaign run for a fractional CFO practice selling a $14,000 advisory retainer. No rounding up for drama. Every stage is measured, every drop-off is named, and every dollar is traceable to a specific page in a specific book.
The book was a 212-page 6x9" trade paperback on cash-flow forecasting for mid-market operators. Print cost through KDP at 212 pages, black ink, 500 copies: $2.30 per unit plus a one-time setup. Total print spend: $1,150. Amazon listing price: $24.99. The author kept 60% royalty on direct KDP sales, roughly $14.99 per copy on Amazon-fulfilled orders after print cost.
The Cohort: 500 Copies Into Two Channels
Distribution split cleanly in half by intent:
250 copies shipped direct to a curated enterprise list — controllers, VPs of finance, and ops directors at companies between $8M and $60M in revenue. Each went out with a handwritten note and a tracking number.
250 copies sold organically through Amazon search, category ranking, and a small $600 ad test that we will evaluate honestly below.
The direct-ship cohort carried higher intent by construction. The Amazon cohort carried higher volume variance. Both matter, and both feed the same funnel.
The Funnel, Stage by Stage
Here is the raw sequence. Read it as a cascade, not a list.
Stage
Count
Conversion Rate
Basis
Copies in readers' hands
500
—
Baseline cohort
Read through Chapter 3
340
68.0%
Of 500
Scanned the Chapter 3 QR code
142
41.7%
Of 340 active readers
Opted in for the companion template
108
76.0%
Of 142 scanners
Booked a 30-minute diagnostic call
28
25.9%
Of 108 subscribers
Closed advisory engagements
3
10.7%
Of 28 calls
Total subscribers captured: 108 email opt-ins. The section title references 180 because a second, smaller print run and a LinkedIn follow-up sequence added 72 more over the following quarter. The core modeled cohort is 108. We keep both numbers honest and separate.
The 68% read-through is the whole story. Industry data on business books suggests most buyers never finish Chapter 1. Getting 340 of 500 readers past Chapter 3 is not luck — it is placement. The QR code sat at the end of a worked cash-flow example, immediately after the reader felt the pain of not having a model. Context beats location.
Where the Revenue Lands
Three advisory engagements at $14,000 each. That is $42,000 in contracted revenue from a $1,150 print investment and a $600 ad test.
Revenue: 3 × $14,000 = $42,000
Print cost: 500 × $2.30 = $1,150
Ad test: $600
Landing page + email tool: $89/month × 3 = $267
Total hard cost: $2,017
Net: $42,000 − $2,017 = $39,983
ROAS on hard cost: 42,000 ÷ 2,017 = 20.8x
Cost per closed client: 2,017 ÷ 3 = $672
Cost per subscriber: 2,017 ÷ 108 = $18.68
Compare that $18.68 per subscriber against paid search. In the same vertical, a Google Ads lead for "fractional CFO" keywords ran $140 to $210 per form fill in Q1. A LinkedIn lead-gen form averaged $95. The book funnel beat both by a factor of 5x to 11x on cost per subscriber — and the subscribers were better qualified.
Why Print-to-Digital QR Bridges Outperform Paid Ads
Five structural reasons, each measurable.
Sunk-cost attention. A reader who paid $24.99 and read 60 pages has already invested roughly 45 minutes. That investment creates reciprocity. An ad impression creates nothing. The opt-in rate of 76% on the landing page reflects that gap.
Contextual relevance. The QR code appeared inside a solved problem, not beside a banner. The reader scanned because the template solved the exact task they were mid-way through. Intent at scan time is near-purchase intent.
Zero auction noise. Paid ads compete in an auction where your message is one of nine on a screen. A book is a single-occupant channel. No competitor bids against page 47.
Deliverability and trust. The opt-in came from a physical artifact the reader owns. Email open rates for this list ran 54% versus a 21% benchmark for cold paid lists. Trust compounds.
Qualification by friction. Scanning a QR code, typing an email, and downloading a template is a three-step commitment. Paid ads optimize for the lowest-friction click. Friction filters. The 108 subscribers were pre-qualified by behavior, which is why 25.9% booked a call.
Do not skip the read-through stage. If only 30% of readers reach the QR code, the entire downstream cascade collapses proportionally. At a 30% read-through, the same 500 copies yield roughly 62 subscribers and 1.7 closed engagements — about $24,000, not $42,000. Chapter placement is not a design detail. It is the throttle on revenue.
The Amazon Cohort Versus the Direct Cohort
Splitting the 500 reveals a second lesson. The 250 direct-ship readers produced 71 of the 108 opt-ins — a 28.4% opt-in rate. The 250 Amazon readers produced 37 — a 14.8% opt-in rate. Direct-ship leads converted at nearly double the rate because the handwritten note created a prior relationship before page one.
The $600 Amazon ad test generated 41 of the 250 organic sales, or $14.63 per sale in ad spend against a $14.99 royalty. That is break-even at best on the book itself. The profit lives entirely downstream. Treat the book as a customer acquisition cost, not a product line.
Reverse-Engineering Your Own Numbers
Work backward from your target. Want $42,000 from a $14,000 offer? You need 3 closes. At a 10.7% call-to-close rate, that is 28 calls. At a 25.9% subscriber-to-call rate, that is 108 subscribers. At 76% landing page conversion, that is 142 scans. At a 41.7% scan rate, that is 340 active readers. At 68% read-through, that is 500 copies in hands.
Every stage is a lever. Improve read-through from 68% to 80% and the same 500 copies produce 127 subscribers and roughly $49,000. Improve the call-to-close rate from 10.7% to 15% and you clear $63,000 without printing an extra copy. The math rewards operators who measure each rung instead of staring at the top of the ladder.
An exhaustive financial and operational teardown of non-fiction ghostwriting costs in 2026. Compare $15,000–$75,000 agency retainers, freelance hourly rates, and modern AI studio economics.
The complete tactical playbook for consultants, advisors, and agency founders. Learn how a 120-page Amazon trade paperback replaces cold outreach, builds instant enterprise authority, and books $25k retainers.